Certificate Revocation Simulator
User's Guide
Starting the Simulator
Starting the Simulator Applet from the command line
This guide mainly discusses the graphical user interface, but a performance gain in the simulation can be achieved by running the
program directly from the command line rather than through a web
browser. The class Simulator is provided for this, and it will
interactively request the required parameters for the simulation. Note
that a graph will not be produced using the command line
Simulator. Also note that JSIM must be installed in order to run the simulator.
To start the Simulator in your command line, type:
java certrevsim.Simulator <simulationTimespan> <systemSize>
<certificateValidationRate> <revocationRate> <revocationValidityPeriod> <numberOfDPs> <deltaDegree>
As an example, try to run through the program with
Timespan=60, Size=100, Revocations Per Day=100, Revocation Rate =
10, Validity Period = 60, numberOfDPs=1 deltaDegree=1, (this is the
ordinary CRL scheme)
Starting the Simulator Applet in a web browser
Open http://www.pvv.ntnu.no/~andrearn/certrev/simapplet.html
in your web browser. The applet should start automatically. If this
does not work, your browser most likely does not support the Java
Applet, or has Java turned off in the browser preferences. Make sure
Java is allowed, or try another browser.
A Guided runthrough
For a quick test of the program, keep the default scheme (CRL), and try and fill in the following
parameters:
Timespan=60, Size=100, Revocations Per Day=100, Revocation Rate =
10, Validity Period = 60
Now, push the button Simulate, and wait for the simulation to
finish. A graph representing the revocation information request rates
will be drawn in the graph panel, and the computed results will be
printed to the result field.
The Applet user interface
The applet consists of five parts, or panels:
- The general parameter panel
- The scheme specific parameter panel
- The command panel
- The graph panel
- The result panel
The General Parameter Panel
The general panel takes the general input that applies to all the
scheme. Input fields in the general parameter panel are the timespan
of the simulation, the system size, the average number of validations
per day and the revocation rate per year. All of these fields must be
filled in.

The Scheme Specific parameter Panel
The scheme specific parameter panel takes the input specific for a
particular scheme. There are three different parameter panels
dependent on the selected scheme:
- CRL: There is only one input field, the revocation information
validity time. It must be filled in. This simulation behaves like
OCSP if the validity time is set to 0 or 1.
- Delta CRL with DP: There are three fields, the revocation
information validity time, the number of Distribution Points, and
the number of Delta CRL periods in a CRL validity period. All
fields must be filled in, but a value of 1 for the number of DPs
or delta periods disables DP and Delta CRLs respectively.
- OCSP: There are no scheme specific input fields.

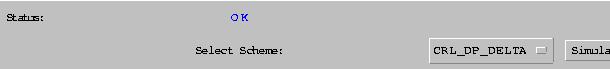
The Command Panel
The Command Panel has a status field and buttons for controlling the
application. There is a Choice box for choosing the scheme to simulate
and a "Simulate" button. When a new scheme is selected, another scheme
specific parameter panel is loaded. The Simulate button starts the
simulation with the parameters in the input fields.
The Graph Panel
The graph panel shows a plot of the revocation request rate (black)
and the delta revocation request rate (red) for the last
simulation. The horizontal axis represents time, whereas the vertical
axis represents the number of requests at a particular time. The graph
is only intended to provide a qualitative illustration of the request
rates, so the actual axis values are not shown.
The Result Panel
The result panel prints a line of output for every simulation run. The
output values are maximum request rate, maximum delta request rate,
maximum network load, maximum processing load and delay.
Last modified: Wed Apr 26 10:23:09 CEST 2000